The Ultra-Processed Share of US Packaged Foods
How much of this index of US packaged foods is ultra-processed (NOVA Group 4), and how that overlaps with flagged additives. Rendered live.
Published:
Research question
Of the packaged foods PlainFoodSafe indexes, what share falls into each NOVA processing group, and how concentrated is the ultra-processed category that nutrition researchers most associate with diet-related disease?
Methodology
The NOVA framework, developed by Carlos Monteiro and colleagues at the University of São Paulo, sorts foods not by nutrient content but by the extent and purpose of industrial processing. Group 1 covers unprocessed or minimally processed foods such as fresh produce, plain grains, and milk. Group 2 covers processed culinary ingredients, oils, butter, sugar, and salt used to prepare food. Group 3 covers processed foods that combine Groups 1 and 2, such as canned vegetables, cheeses, and freshly baked bread. Group 4, ultra-processed foods, covers industrial formulations built largely from substances extracted from foods or synthesized in laboratories: soft drinks, packaged snacks, reconstituted meat products, and pre-prepared frozen dishes, typically carrying additives that exist to imitate sensory qualities or disguise undesirable ones.
Open Food Facts contributors assign a NOVA group to a product based on its ingredient list and category. PlainFoodSafe imports those assignments and aggregates them in the nova_summary table, which stores one row per NOVA group with a product count and a percentage share. This page renders both figures live: the percentages come straight from the stored share, and the absolute counts from the stored product totals. Because Open Food Facts is a contributor-built catalogue, not every indexed product carries a NOVA assignment, the denominator here is the 382,974 products that do. The share figures therefore describe the classified subset, not the full index, and are most useful as a relative picture of how the processed end of the catalogue is distributed.
See our methodology page for the full ingest pipeline, the safety-score definition, and how flagged additives are identified from the FDA Substances Added to Food inventory and the CSPI Chemical Cuisine ratings.
Share of classified products by NOVA processing level
Live from the database · n = 382,974 NOVA-classified products
What the numbers show
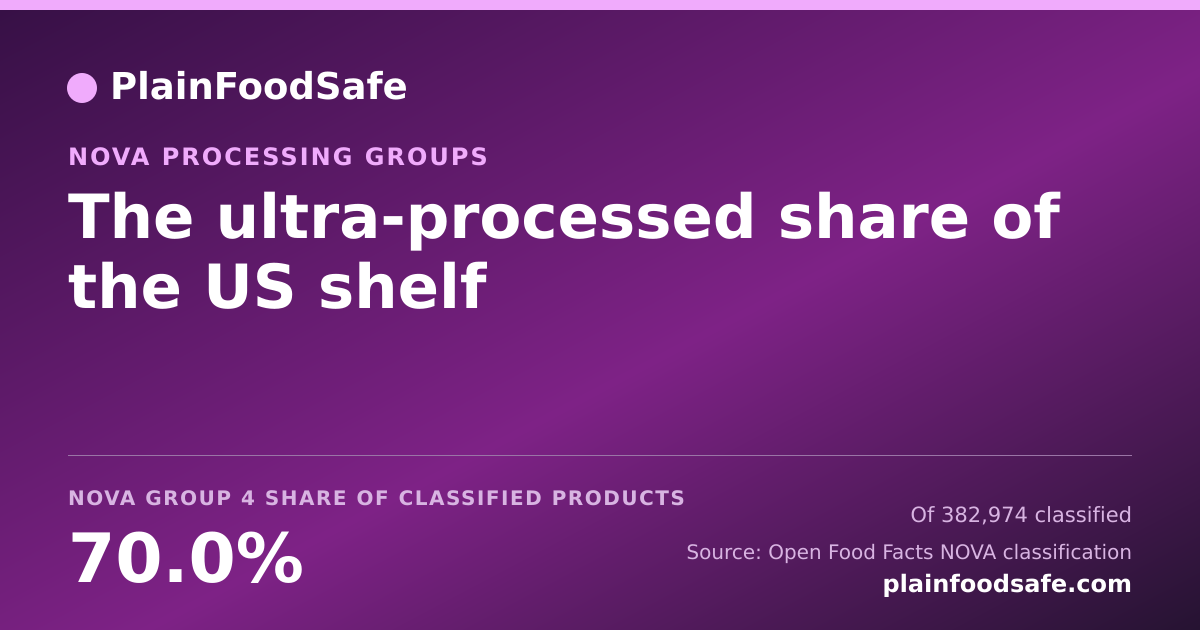
Across the 382,974 classified products in our index, 70% fall into NOVA Group 4, ultra-processed. That single group accounts for 268,137 products, more than every other processing level combined. At the opposite end, only 10% of the classified catalogue is unprocessed or minimally processed (Group 1). The shape of this distribution is the central fact of the modern American packaged-food shelf: it is overwhelmingly weighted toward industrial formulations, with whole and lightly handled foods a small minority of what is sold in a box, bag, or bottle.
This skew is not an artefact of our catalogue. Independent dietary-intake studies using the same NOVA framework have repeatedly found that ultra-processed products supply well over half of the calories Americans consume, and a larger share still of the products on offer. Our index measures products rather than calories or sales, so it answers a slightly different question, how much of the shelf, by distinct item, is ultra-processed, but it lands in the same territory and from a fully independent dataset.
Why ultra-processing and additives travel together
The reason a food-safety project tracks NOVA at all is that ultra-processing is where additives concentrate. By definition, Group 4 products are built to be shelf-stable, uniform, and hyper-palatable, and the ingredients that deliver those properties, synthetic dyes, emulsifiers, high-intensity sweeteners, and preservatives, are exactly the substances regulators and food-policy groups flag for elevated scrutiny. The additives PlainFoodSafe tracks are not randomly distributed across the catalogue; they cluster in the ultra-processed tier.
Most common flagged additives, by product presence
Indexed products containing each flagged additive, the substances concentrated in ultra-processed foods
Reading the two charts together
The first chart says most of the shelf is ultra-processed; the second says which additives that reality puts in front of shoppers. The synthetic dyes at the top of the flagged-additive ranking, Red 40, Yellow 5, and their siblings, appear in tens of thousands of products precisely because they are cheap, stable colourants ideal for the Group 4 formulations that dominate the catalogue. The same logic explains the prominence of caramel colouring, carrageenan, and the preservative set: each solves a manufacturing problem that only arises at industrial scale.
None of this is a verdict on any single product. A food being ultra-processed does not make it unsafe at typical intake, and a flagged additive is a signal for scrutiny, not a finding of harm. What the data does establish is structural: if you want to lower your exposure to the additives regulators watch most closely, the single most effective lever is moving down the NOVA ladder, choosing more Group 1 and Group 3 foods and fewer Group 4 ones, rather than trying to memorise an avoid-list. The processing level is the upstream variable; the additives are downstream of it.
How to use this analysis
Shoppers can apply the finding directly at the shelf: the longer and more unfamiliar an ingredient list, the more likely a product sits in Group 4 and carries one of the flagged additives charted above. Our ingredient index lets you look up any additive's FDA status and CSPI rating, our dye phase-out tracker follows the six synthetic colours now being removed, and our brand rankings show which large brands carry flagged additives across the highest share of their catalogue. Researchers and journalists are welcome to cite this page; every figure is queried live from the database and refreshes whenever the underlying Open Food Facts vintage is reingested.
Source: NOVA processing classification from Open Food Facts; flagged-additive overlay from the FDA Substances Added to Food inventory and CSPI Chemical Cuisine. Figures reflect the most recently published dataset.
Sources
- Open Food Facts, public product database with NOVA classification (CC0) - world.openfoodfacts.org
- Monteiro et al. - the NOVA food classification system - world.openfoodfacts.org/nova
- CSPI, Chemical Cuisine additive ratings - cspi.org/page/chemical-cuisine-food-additive-safety-ratings
Embed this on your site
Free to republish under CC BY 4.0. The image is generated from our live index, so it stays current after you paste it. Please keep the link.