US Packaged Food Statistics
A source-attributed snapshot of product labels, processing groups, additive prevalence, and state food-additive actions in the PlainFoodSafe dataset, current through September 1, 2026.
Download the category-safety extract: category-safety.csv · more tables on Open Data Downloads.
894,137 packaged-food records with NOVA, score-band, and additive prevalence stats
This statistics surface summarizes 894,137 packaged-food records and 251,493 normalized ingredient names as of September 1, 2026. The scoreable subset covers 382,839 products with both a usable ingredient list and NOVA group; 26 additives carry a separately sourced flag. Aggregates use Open Food Facts labels plus FDA SAFFA and CSPI Chemical Cuisine, descriptive coverage counts, not product endorsements or medical claims.
- 894,137 product records
- 382,839 scoreable products
- 26 flagged additives
- 6 states with actions
At a glance
PlainFoodSafe contains 894,137 packaged-food records and 251,493 normalized ingredient names. Its scoreable subset contains 382,839 products with a usable ingredient list and NOVA group; these figures describe source coverage and label patterns, not the healthfulness, allergy safety, or official approval of any product.
- 894,137
- product records in the full database
- 251,493
- normalized ingredient names
- 382,839
- products in the score-distribution subset
- 26
- additives with a separately sourced flag
Source snapshot: Open Food Facts product labels and NOVA classifications, cross-referenced with FDA SAFFA and CSPI Chemical Cuisine. Data vintage: September 1, 2026.
Key findings
Each finding is computed from the current database and includes its denominator where the figure describes a subset.
- 894,137 packaged-food records are represented in the full PlainFoodSafe database as of September 1, 2026.
- 382,839 products (42.8% of all records) have both a usable ingredient list and NOVA group, making them eligible for the displayed score distribution.
- 319,270 scoreable products (83.4%) fall in the 90-100 score band, the largest of the three displayed bands.
- 268,137 NOVA-classified products (70.0%) are Group 4, measured only within the 382,974 records carrying a NOVA classification.
- Caramel Coloring appears on 23,161 indexed product labels, the highest raw label count among the separately flagged additives in this snapshot.
- 32 action records across 6 states are held in the regulation tracker; its 9 federal records are labeled separately and excluded from the state count.
Safety-score distribution
The scoreable cohort requires a non-empty ingredient list and a NOVA classification. Scores are PlainFoodSafe's derived ingredient-screening index, not FDA ratings.
| Score band | Products | Share of scoreable subset |
|---|---|---|
| 90-100 | 319,270 | 83.4% |
| 70-89 | 33,457 | 8.7% |
| Below 70 | 30,112 | 7.9% |
Figure: 382,839 products meet the displayed score-cohort rules as of September 1, 2026.
NOVA processing distribution
NOVA groups are supplied by Open Food Facts. Percentages use only the 382,974 products with a recorded NOVA group, not the full database.
Figure: 268,137 products (70.0%) are classified as NOVA Group 4 within the classified subset.
Most prevalent flagged additives
A flag means the additive has a separately stored FDA SAFFA status, CSPI rating, synthetic-dye designation, or state-restriction record. Prevalence is a product-label count, not an exposure or risk estimate.
Figure: Caramel Coloring is the most prevalent flagged additive in this snapshot, appearing on 23,161 indexed product labels.
Regulatory coverage
The tracker contains 32 state and federal action records across 6 states, plus 9 explicitly labeled federal actions. Proposed, enacted, and effective measures remain distinct in the underlying table.
- 32state + federal action records
- 6states represented
- 9federal actions, not counted as states
See the regulation tracker for the ingredient, action type, status, legislation, and effective date behind each record.
What to do with these statistics
Turn a catalog pattern into a specific check
Use these totals to choose a record or topic to inspect, not to decide whether a particular product is safe or suitable.
- Open a named ingredient to see the stored FDA SAFFA and CSPI context behind a prevalence count. Browse ingredient records
- Check a product label or barcode when you need the exact ingredients captured for one package. Open product lookup
- Review the regulation tracker when a statistic points to a state or federal action. See regulation records
These are descriptive catalogue totals from the stated sources and vintage. They do not establish exposure, a recall, a ban for every product, or an individual health or safety outcome.
How to cite and reuse these figures
Cite the section anchor, data vintage, and cohort denominator with any figure. Open Food Facts records are community-maintained and formulations can change, so a current package remains the authority for a specific product label. Read the methodology for joins, score rules, and source limitations.
Embeddable processing figure
This plain-HTML figure keeps the denominator and source attached. Copy it into an article or data note; the source link is deliberately nofollow.
<blockquote><p>Among 382,974 NOVA-classified products in PlainFoodSafe, 70.0% are Group 4 (ultra-processed) as of September 1, 2026.</p><a href="https://plainfoodsafe.com/statistics#processing-distribution" rel="nofollow">Source: PlainFoodSafe</a></blockquote> PlainFoodSafe's original summary prose and key-findings wording are dedicated to CC0 1.0. Underlying Open Food Facts records remain licensed under ODbL; FDA source materials and CSPI ratings retain their respective source terms. Attribution is requested so readers can inspect the denominator, vintage, and methodology.
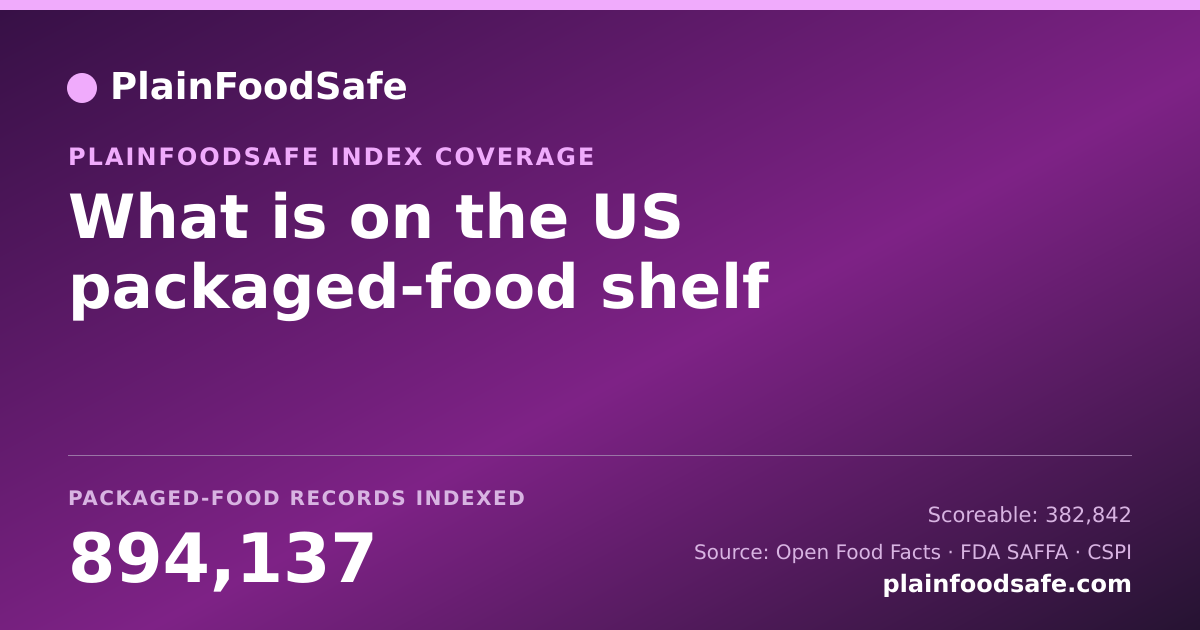
Embed this on your site
Free to republish under CC BY 4.0. The image is generated from our live index, so it stays current after you paste it. Please keep the link.

Every figure on PlainFoodSafe is rendered directly from OpenFoodFacts and FDA data, no number is typed in by an editor. Every count on this page is queried from the current product, ingredient, NOVA, flagged-additive, or regulation tables; no headline figure is typed in by an editor. See our editorial standards & corrections policy, the methodology behind these numbers, or report a data error. Data current as of September 1, 2026.