Food Safety by Category
Not all food categories are equal when it comes to ingredient safety concerns. This analysis computes the real average safety score and flagged-ingredient rate for our 8 largest tracked categories, against FDA SAFFA regulatory data and CSPI Chemical Cuisine ratings.
Category evidence desk
How the largest food categories compare
These comparisons use the same catalogued-product rows as the table below. A flag is a stored FDA SAFFA or CSPI field, not a recall, ban, or personal safety recommendation.
Flagged-ingredient coverage by category
Sweet snacks has the largest share of catalogued products carrying at least one stored caution field in this eight-category cohort.
Sweet snacks versus every tracked category
The marker locates this category's average stored score within the eight-category distribution, so the highest flag share is read alongside its broader catalog pattern.
Sweet snacks average score in context
Highest flagged-ingredient share: 34.3% of 54,315 catalogued products
80 13th percentile sits above 13% of the 8 tracked categories we track
Each bar is a band; taller bars hold more tracked categories. The dashed line + filled bar mark this entry. Hover or tap any bar for its full count, share, and where it sits relative to this entry.
Distribution as text
- 75–80
- 1 tracked categories (13%)
- 80–85
- 0 tracked categories (0%)
- 85–90
- 1 tracked categories (13%)
- 90–95
- 1 tracked categories (13%)
- 95 and above
- 5 tracked categories (63%)
Source PlainFoodSafe category-safety table, computed from stored product labels · September 2026
Key Findings
- 1. Plant-based foods has the lowest flagged-ingredient rate among our largest categories, at 6.6% (79,878 products, avg score 97.8/100).
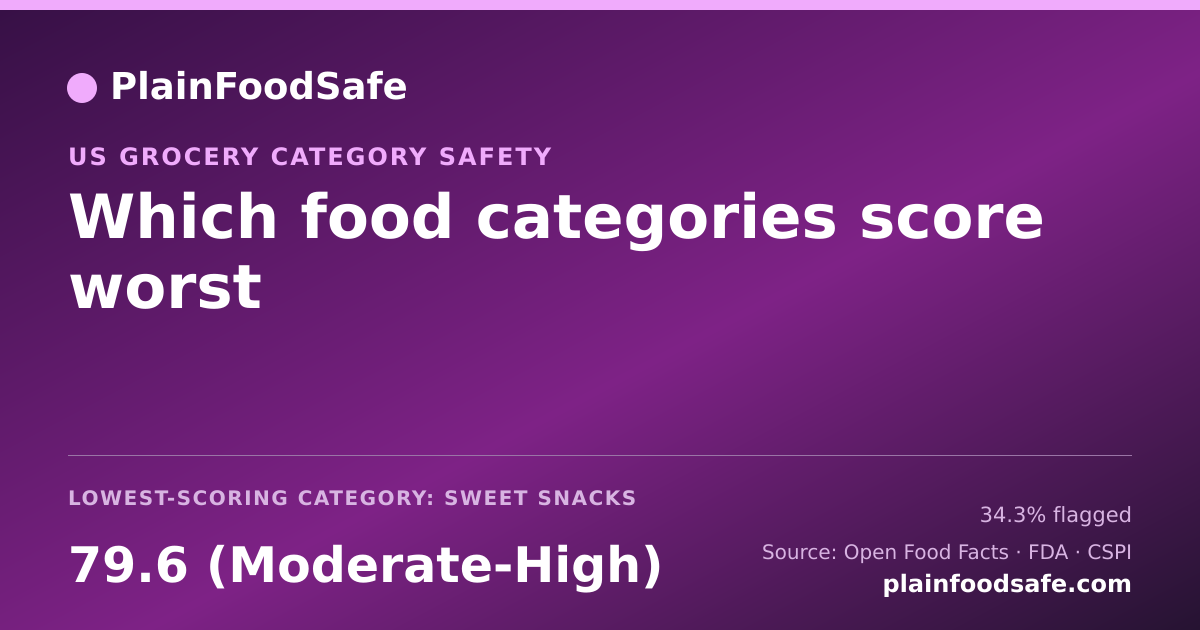
- 2. Sweet snacks has the highest flagged-ingredient rate at 34.3% (54,315 products, avg score 79.6/100).
- 3. Ingredient count correlates with safety score: products with 1-5 ingredients average 99.7/100 (1.8% flagged), while products with 16+ ingredients average 88.4/100 (35.9% flagged).
- 4. Every category shows real variation between individual products, even the highest-flagged category still has clean alternatives, and the lowest-flagged category still has some flagged products. Use the rankings page to compare specific products.
| Category | Products | Avg. Safety Score | % Flagged | Concern Level |
|---|---|---|---|---|
| Snacks | 95,697 | 86.1/100 | 25.5% | Moderate |
| Plant-based foods and beverages | 94,457 | 97.7/100 | 7.4% | Minimal |
| Plant-based foods | 79,878 | 97.8/100 | 6.6% | Minimal |
| Sweet snacks | 54,315 | 79.6/100 | 34.3% | Moderate-High |
| Beverages | 50,151 | 90.5/100 | 20.3% | Low |
| Condiments | 35,578 | 98.3/100 | 12.6% | Minimal |
| Cereals and potatoes | 32,200 | 96/100 | 11.6% | Minimal |
| Groceries | 28,111 | 98.3/100 | 14.4% | Minimal |
Computed directly from our database: average safety score and share of products carrying an FDA SAFFA or CSPI caution flag, for the 8 categories with the most cataloged products.
Embed this on your site
Free to republish under CC BY 4.0. The image is generated from our live index, so it stays current after you paste it. Please keep the link.
Turn a category pattern into a specific check
Use the category table to choose where to look closer, then inspect a named product or ingredient record rather than treating an average as an individual result.
- Compare the flagged-field share with the product count before treating a category as a useful starting point for a label review. See the ranked product views
- Open an ingredient record to see the stored FDA SAFFA and CSPI context behind a specific label term. Browse ingredient records
- Use a barcode or product name to inspect the exact stored label fields for one package. Open product lookup
Category averages and stored caution fields describe this catalogue's source coverage. They do not establish a recall, a ban, an exposure level, or an individual medical or safety outcome.
Why Ingredient Count Matters for Safety
Across our full catalog, ingredient count correlates with safety score. Products with 1-5 ingredients average 99.7/100, with only 1.8% carrying a flagged ingredient. Products with 16+ ingredients average 88.4/100, with 35.9% flagged. Highly processed categories inherently tend toward longer ingredient lists for shelf stability, color, and texture.
This does not mean processed food is inherently dangerous, it means that consumers who want to minimize their exposure to controversial additives should look at the ingredient count on the label itself, and use the brand comparison tool to find cleaner options within a category.
The Within-Category Opportunity
Every category in the table above contains a real mix of safety scores, not a single fixed number. Even Sweet snacks, the highest-flagged category we track, still has clean, unflagged products within it, and even Plant-based foods, the lowest-flagged, still contains some flagged products.
That variation is what a category view is for: two products of the same type can differ substantially in flagged-ingredient count, so within-category spread is where this record carries the most information. Browse our rankings page to compare specific products.
Related Resources
- How Safety Scores Work - detailed explanation of the scoring methodology
- How to Read Food Labels - practical guide to decoding ingredient lists
- Safest Food Brands - data analysis of 36,827 brands by safety score
- Children's Food Safety Guide - additive concerns specific to children's products
Data source: OpenFoodFacts; FDA, SAFFA; CSPI, Chemical Cuisine.
Data current as of: September 2026