Top 20 Most Common Food Additives in US Products
The additives that appear in the most US grocery products across the Open Food Facts catalogue, ranked live from the database.
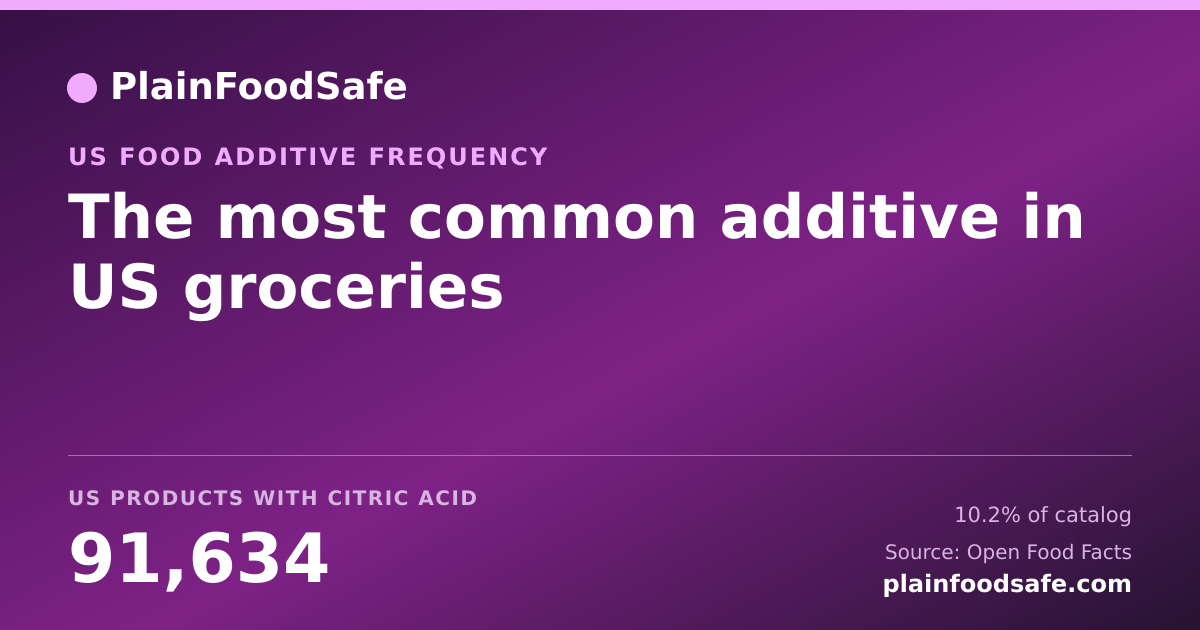
Citric Acid is the most common additive in this catalogue, on 91,634 products (10.2%)
Across 894,137 Open Food Facts US grocery products ingested by PlainFoodSafe, Citric Acid leads product count at 10.2%, followed by Natural Flavor at 6.9%. Counts come from a live GROUP BY on ingredients plus product_ingredients, not a curated list. Presence is a label-occurrence fact, not a safety verdict or medical recommendation.
- 10.2% Citric Acid share
- 6.9% Natural Flavor share
- 20 additives ranked
The short answer
Citric Acid leads this catalogue at 91,634 products (10.2%), ahead of Natural Flavor at 6.9%; additive #20 on the same list appears in 33,252 products (3.7%), and the median of these 20 counts is 43,845.
- 10.2%
- Citric Acid catalogue share
- 6.9%
- Natural Flavor in second
- 3.7%
- additive #20 cutoff
- 20
- additives on this ranked extract
Presence is a label-occurrence fact from the current Open Food Facts snapshot, not a safety verdict or medical recommendation.
Examination of 894,137 US grocery products from the OpenFoodFacts dataset (ingested into PlainFoodSafe) identifies the most frequently occurring food additives by product count. Citric Acid leads with presence in 91,634 products (10.2% of dataset) - reflecting its widespread use as an acidulant, preservative, and flavor enhancer across beverages, baked goods, and processed foods. The page renders SSR-from-DB, so values always reflect the current ingested snapshot.
Top 20 additives by product count
| # | Additive | Product count | Share |
|---|---|---|---|
| 1 | Citric Acid | 91,634 | 10.2% |
| 2 | Natural Flavor | 61,894 | 6.9% |
| 3 | Folic Acid | 58,687 | 6.6% |
| 4 | Riboflavin | 58,035 | 6.5% |
| 5 | Niacin | 53,405 | 6.0% |
| 6 | Wheat Flour | 52,687 | 5.9% |
| 7 | Soy Lecithin | 52,294 | 5.8% |
| 8 | Corn Syrup | 46,998 | 5.3% |
| 9 | Sea salt | 46,613 | 5.2% |
| 10 | Spices | 45,370 | 5.1% |
| 11 | Natural Flavors | 43,845 | 4.9% |
| 12 | Corn Starch | 42,123 | 4.7% |
| 13 | Soybean Oil | 41,890 | 4.7% |
| 14 | Dextrose | 41,251 | 4.6% |
| 15 | Garlic | 40,502 | 4.5% |
| 16 | Enzymes | 38,235 | 4.3% |
| 17 | Milk | 37,147 | 4.2% |
| 18 | Xanthan Gum | 36,931 | 4.1% |
| 19 | Reduced Iron | 36,637 | 4.1% |
| 20 | Maltodextrin | 33,252 | 3.7% |
What this shows.Bar width is product-count as a share of the #1 additive on this list. Hover a focal cell for share-of-leader and rank.
Embed this on your site
Free to republish under CC BY 4.0. The image is generated from our live index, so it stays current after you paste it. Please keep the link.
Methodology
Counts are computed live from the product_ingredients junction table in the PlainFoodSafe database, which reflects ingredient-list parsing of US-labeled OpenFoodFacts products. Salt, sugar, and water are excluded as primary ingredients rather than additives. Percentages are computed against the total product count at SSR time.Source: OpenFoodFacts, https://world.openfoodfacts.org/data
Caveats and Limitations
OpenFoodFacts is crowdsourced, coverage varies by category and brand, and ingredient lists may be incomplete or contain scanning errors. Synonyms (e.g., "vitamin C" vs "ascorbic acid") may be normalized inconsistently across products. Counts do not imply daily intake risks; this is purely a frequency analysis. For regulatory status, cross-reference FDA GRAS lists and the ingredient browser.
Every figure on PlainFoodSafe is rendered directly from OpenFoodFacts and FDA data, no number is typed in by an editor. This page draws directly on OpenFoodFacts and FDA data, no figure is typed in by an editor. See our editorial standards & corrections policy, the methodology behind these numbers, or report a data error.